Validation of models
To assess the reliability of models before they are used to aid decisions, they (models) have to be validated. Two steps must be taken to validate a model once it has been built.
The first is to test its accuracy with new data and new combinations of variables to determine if the model can describe the experimental data sufficiently. This is called internal validation, also termed “Curve fitting”. This will allow an estimation of the goodness of the goodness of fit and will show if and where additional data is needed. Complex models tend to be very specific, which can be a limitation when testing new data.
The second step is to compare model predictions with microbial responses in actual foods. This is called External Validation. This will show the model’s limitations and may show if additional factors must be tested and included in the model. Errors in growth or survival should always tend towards faster growth rates or better survival, respectively, to make a conservative prediction (Whiting, 1995).
Models cannot be used with confidence, until this validation is done. Growth rates or Statistical measures like Root Mean-square Error (RMSE) and regression coefficient of determination (r2) values were used by Duh and Schaffner (1993) to assess the reliability of predictive equations developed based on measurements in brain heart infusion broth and those of literature values in food. These terms have been used to mathematically compare data derived from literature (Giffel and Zwietering, 1999). McClure et al. (1993) compared their models on the basis of the sum of the squares of the differences of the natural logarithm of observed and predicted values and suggested that a smaller value indicates a model, which, on average, better predicts the observed response. Two important factors for validation of predictive models are accuracy factor and bias factor introduced by Ross (1996). Accuracy and bias factor are the mean square differences between predictions and observations (Baranyi et al. 1999).
Use ComBase
Software packages based on developed mathematical models can predict the growth of spoilage and pathogenic microorganisms, as a function of the processing and storage environment of a certain food. One such package is ComBase.
To use ComBase registration is required. There is no cost for registration. Once registered, the user logs on using a password and their Email address.
ComBase (web-based resource for quantitative and predictive food microbiology) is used as a large database of microbial for response of pathogens and spoilage microorganisms to environmental factor (temperature, pH and salt concentration, etc). Although ComBase contains a vast amount of experimental records, one of the most significant application in ComBase is models predict the growth/survival of foodborne pathogens, predictive models for ComBase Predictor are based only on output from experiments recorded in laboratory under well controlled laboratory situation. The discrepancy of cell concentration quantity described by a mathematical curve (growth or survival) (Baranyi and Tamplin, 2004). Neural networks have been well established through the technology for solving prediction and classification problems, using training and testing data to build a model. The data involve historical data sets containing input with significant contributing factors (Haykin et al., 2009). The network uses the training data to learn how to find solution to the problem by previous data, so, the output strongly dependent on network information factors.
ComBase Predictor is selected and the growth options from the navigation menu on the left are completed (Figure 2).
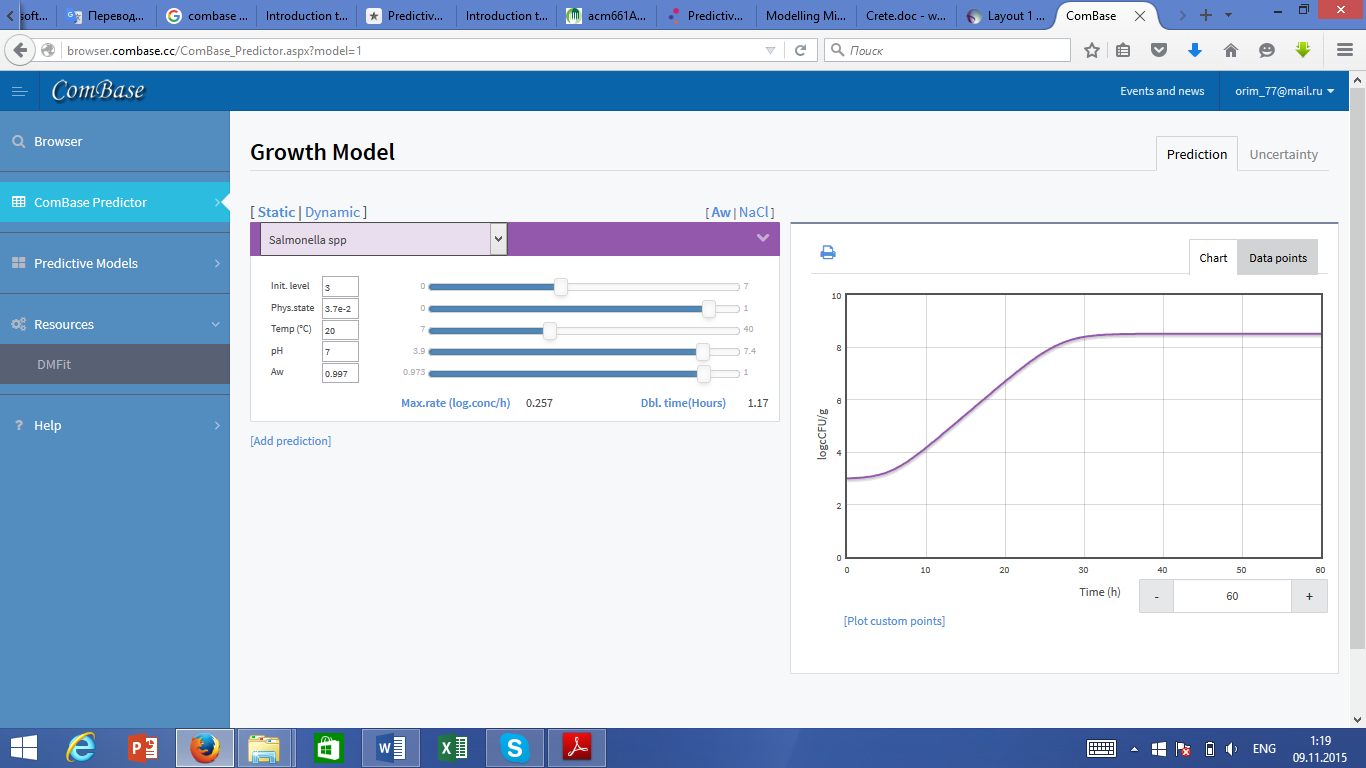
Figure 2. ComBase Predictor.
Numbers are entered as log10 values, so the Initial Level box is filled using 1. A value of 1 for Physical State was selected on the assumption that the cells added were fully active and in the early log phase. The pH (4.6) and Aw (0.997) values used reflect values reported for tomato puree (Jakobsen, M. (1983). Filament hygrometer for water activity measurement: interlaboratory evaluation. Journal of the Association of Official Analytical Chemists. 66. 1106-1111.). Note the pH and Awvalues for tomatoes vary, pH values within the range 4.2 to about 4.6 have been reported. Labuza (1984 Moisture sorption: Practical Aspects of Isotherm measurement and use. St Paul, MN. AACC International Publishing) has reported Awvalues for fresh tomatoes as varying from 0.991-0.998 and a value of 0.993 for pulped tomatoes.
The results in Table 1 show that Combase Predictor gives higher growth rates for salmonella than the Pan and Schaffner model as found by Pan and Schaffner (Pan, W. and Schaffner, D.W. (2010). Modelling the Growth of Salmonella in Cut Red Round Tomatoes as a Function of Temperature. Journal of Food Protection. 8, 1408-1590.).
Using these settings in ComBase to obtain the number of salmonella predicted after 5 hours incubation at the temperatures shown in Table 1.
Table 1. Comparisons of salmonella growth on cut tomatoes at various temperatures using the ComBase microbial growth predictor and the Pan and Schaffner model
| Numbers* of Salmonella species, CFU/g, on cut tomatoes after 5 hours at 22°C. | ||
| Temperature,°C | Pan and Schaffner model | Combase Predictor |
* Based on an initial inoculum of 10 cells.
Дата добавления: 2016-04-22; просмотров: 1265;