InstallShield Express программасы
Critical value we can calculate in Excel (Chi2).
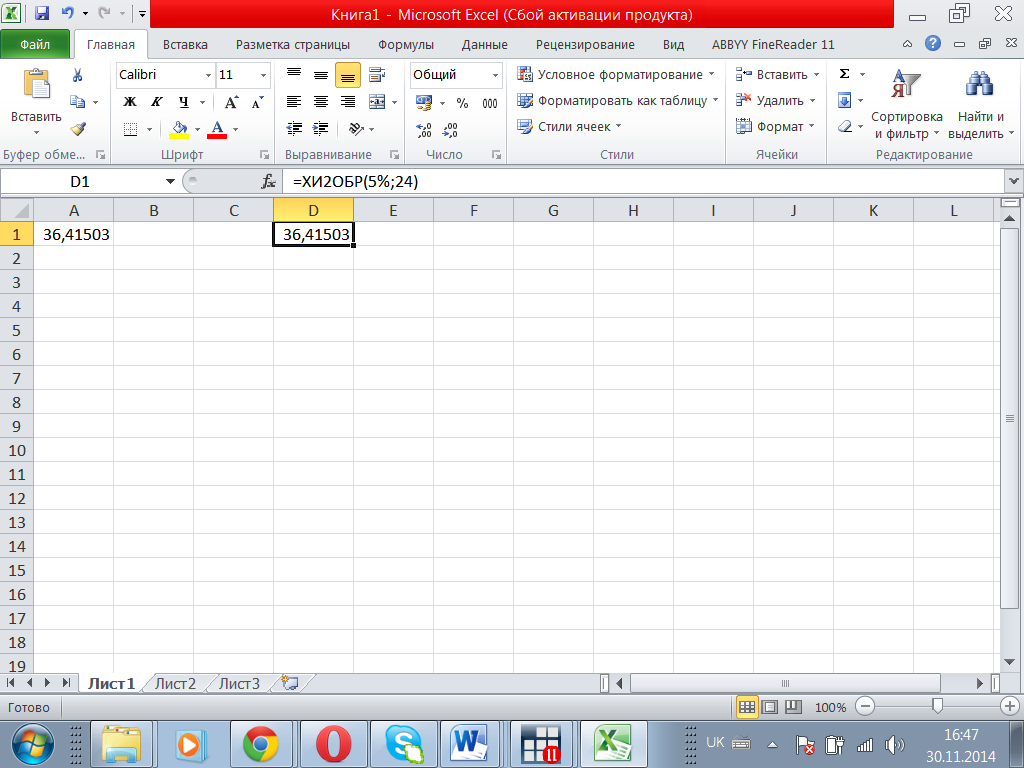
36,415 > 22,592, so we accept the H0 about homoskedasticity.
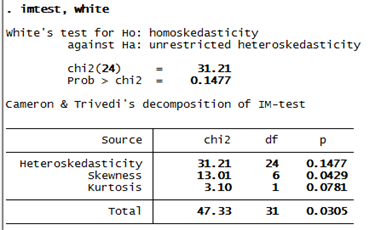
4) Try the STATA version of White test using the commands.
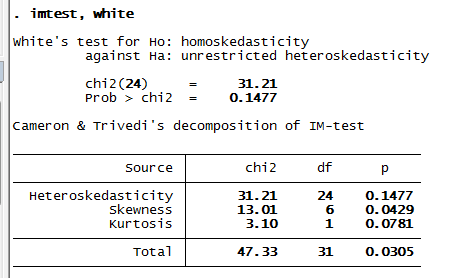
p-value = 0,1477, we accept the H0: homoscedasticity, so there is no heteroskedasticity.
5) Apply Breusch-Pagan test for heteroscedasticity. How strong is the evidence of heteroscedasticity with this test?
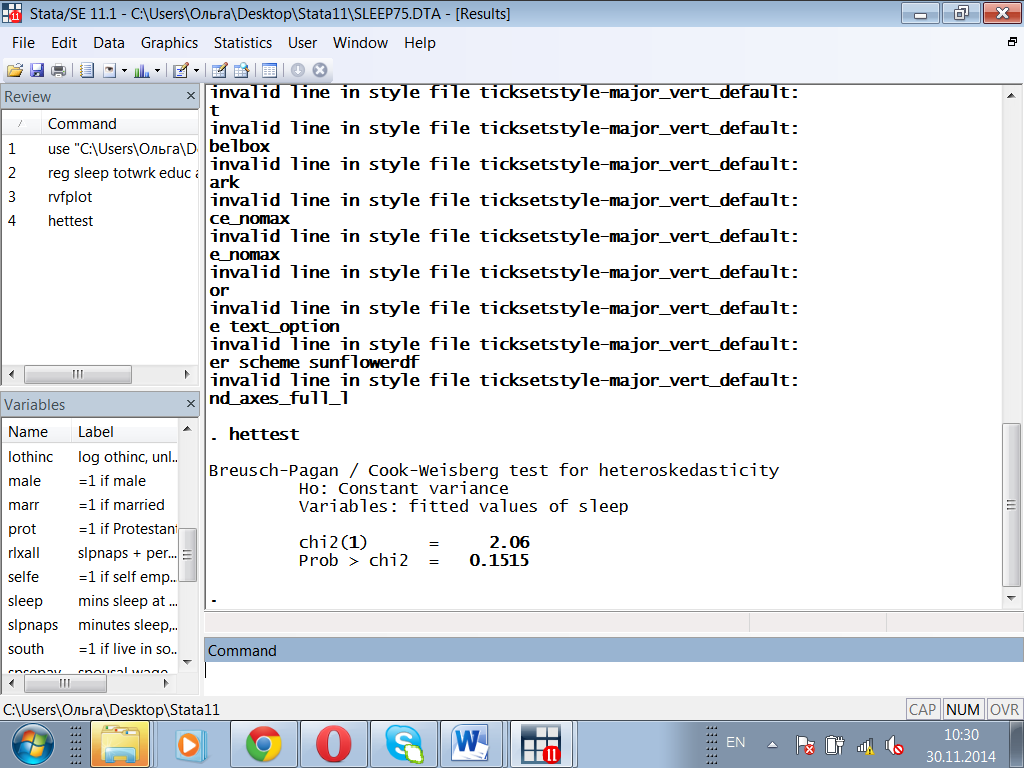
p-value = 0,1515, so we accept H0, which means that there isn’t problem of heteroscedasticity.
6) What are the ways to remedy the problem of heteroscedasticity?
1. Redefing the variables
· in order to reduce the variance of observations with extreme values ;
· e.g. by taking logarithms or by scaling some variables.
2. Weighted Least Squares (WLS).
3. Heteroscedasticity-corrected robust standard errors.
7) Apply one of them. What would you conclude, did the model improve or not?
The easiest way would be to take weighted least squares regression, or regression with robust errors.
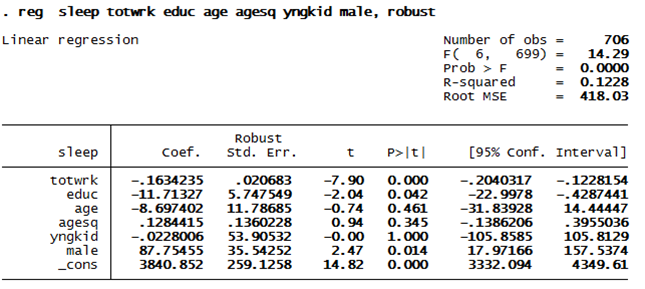
So, the model didn’t change (improve)? Because we didn’t have the problem of heteroscedasticity from the very beginning.
Assignment #6 (2 points)
Open the database CONSUMP.RAW.
1) Estimate a simple regression model relating the growth in real per capita consumption (of nondurables and services) to the growth in the real per capita disposable income. Interpret the model and the coefficients.
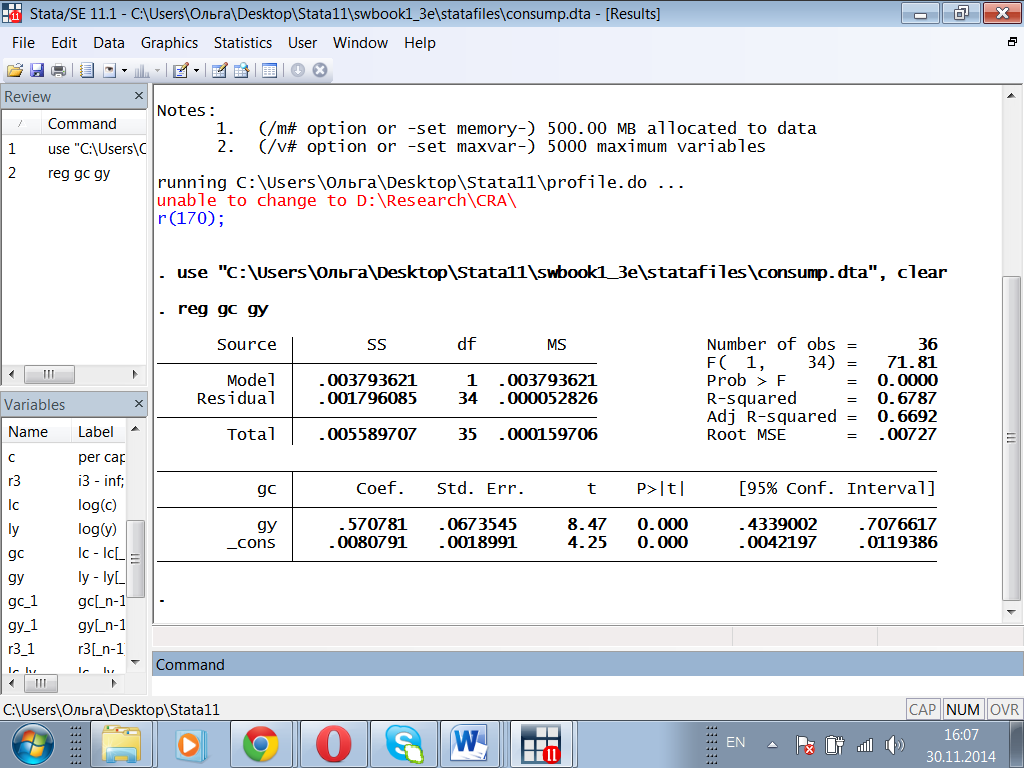
According to the t-test and p-value, our coefficient is statistically significant.
Interpreation:
B1: if real per capita disposable income changes by 1 %, the real per capita consumption would increase by 0,57%.
In general the model is COMPARATIVELY good, R2 = 0,6787, chosen factor explains 67,87% of Y.
2) Do a visual analysis of autocorrelation? What can you say just from the graph?
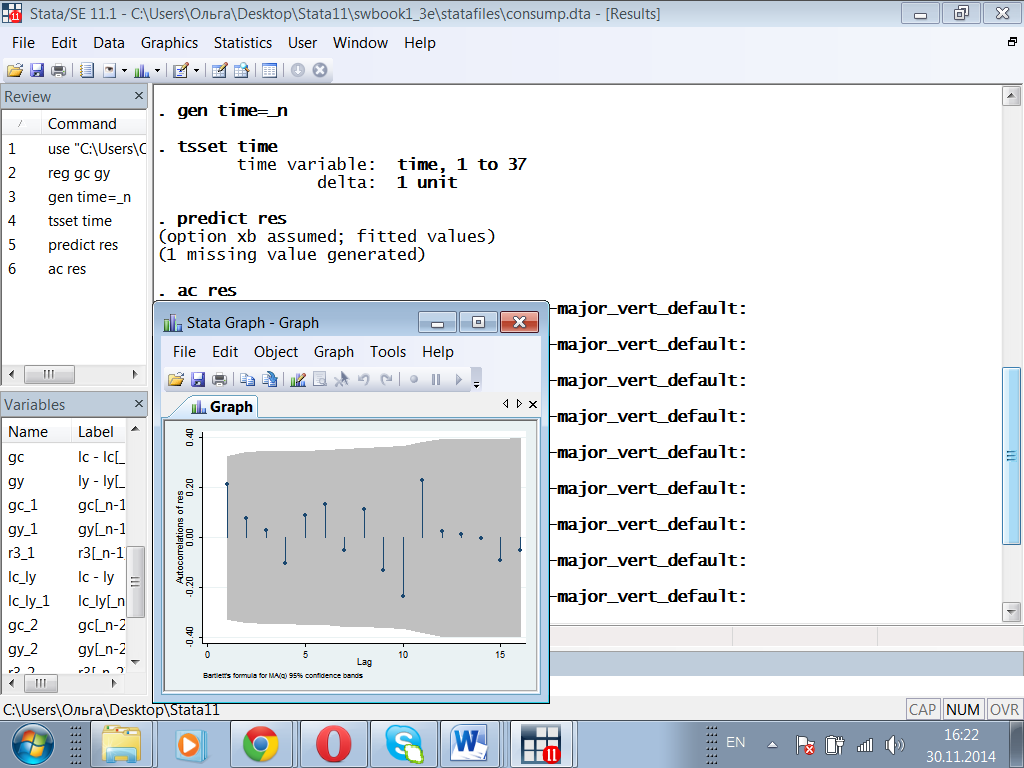
From the graph we see that the residuals don’t have a pattern, so we can make a conclusion that there isn’t the problem of autocorrelation.
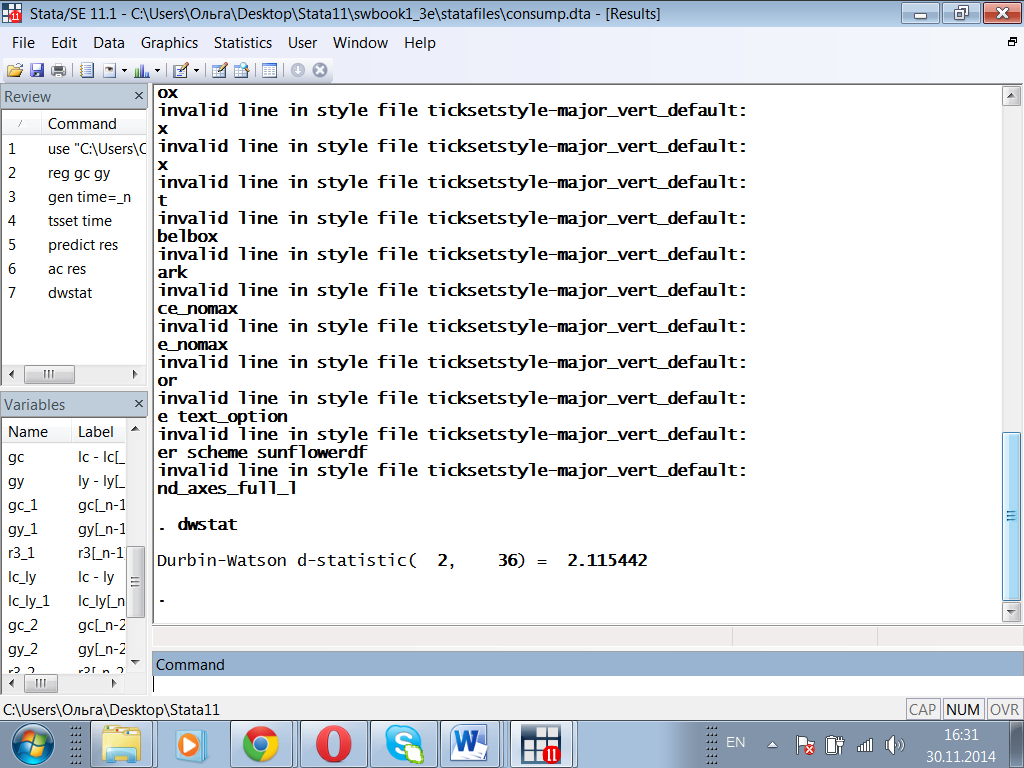
3) Apply Durbin-Watson test for autocorrelation? What is the idea of the test? First, find the d-statistics then do a graph. Describe how did you find the decision about the autocorrelation.
DW test has a scale from 0 to 4:
0 - strong positive autocorrelation;
4 - strong negative autocorrelation;
2 - no autocorrelation.
We need dU and dL values to find the intervals of uncertainty. Their values we take from tables based on n-number of observations (36) , and k-number of parameters (2).
For (k=2, n=36) dU =1,587, dL=1,354
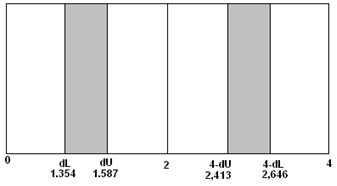
So we assume that we don’t haave autocorrelation.
4) Test for autocorrelation with Breusch-Godfrey LM test? What can you say about the result? Compare to the previous one.
DW-test tests for the autocorrelation of the 1st order. To compare we have to take BG test also with the 1st order.
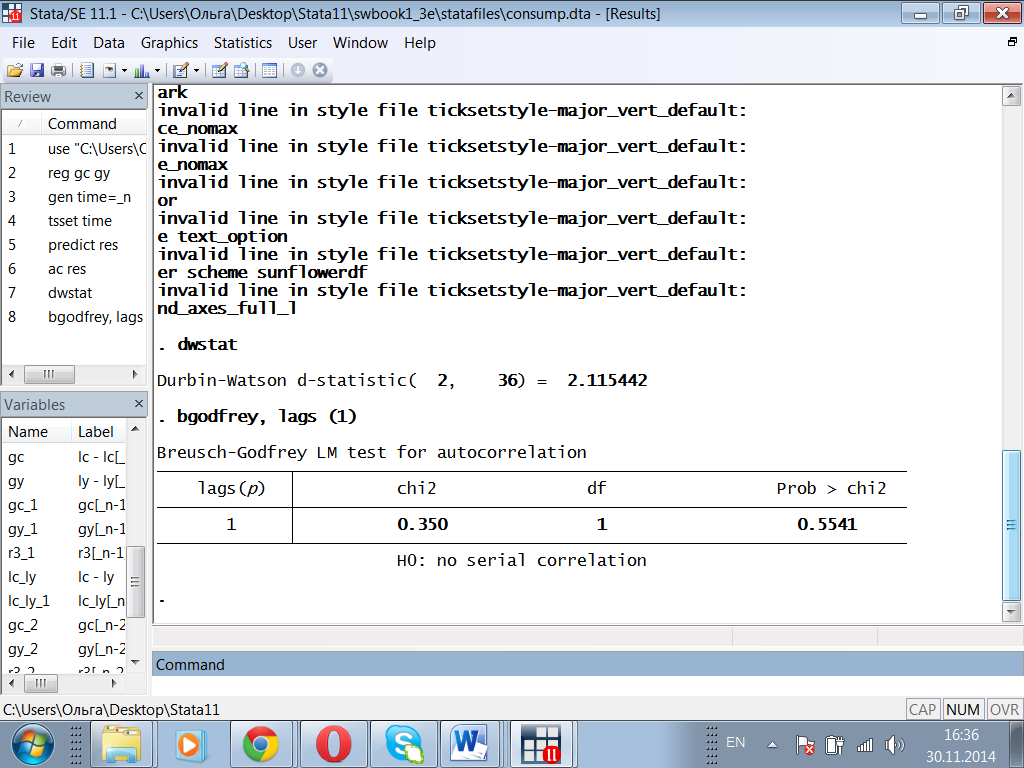
p-value = 0,5541, so we accept the H0: no serial correlation.
The results of Breusch-Godfrey and Durbin-Watson tests are the same: no autocorrelation.
5) What are the remedies for autocorrelation. Up to your choice apply one of them. What can you say about the model now?
There are such approaches to resolving problems of autocorrelation as:
· Lagged dependent variables;
· Differencing the Dependent variable;
· GLS;
· FGLS.
But in most cases when the autocorrelation is not very strong, possible strategy “do nothing” can also be good.
We even don’t have autocorrelation, so we don’t need to use remedies and we do nothing.
Assignment #7 (4 points)
Read the paper The Colonial Origins of Comparative Development: An Empirical Investigation by D. Acemoglu, S. Johnson and J. A. Robinson http://www.nber.org/papers/w7771 and answer briefly the following questions:
(a) What do the authors want to estimate?
The authors want to estimate the effect of institutions (colonization policies) on economic performance (especially on income per capita) by exploiting differences in the mortality rates faced by European colonists in 17-19 centuries.
(b) Write down the model estimated by OLS and explain the choice of variables (what they measure and why they are included in the regression)?
log yi = μ + αRi + Xi γ+ε,
where yi is income per capita in country i, Ri is the protection against expropriation measure, Xi is a vector of other covariates, and ε is a random error term. The coefficient of interest throughout the paper is α, the effect of institutions on income per capita.
The authors decided to include these variables to the regression to explain how different institutions influence economic life in ex-colonies. As an identifier for economic life income per capita was taken, while protection against expropriation measure explains the character of policy of metropolitan country.
(c) Interpret the coecients estimated by OLS.
The regression shows that there is a strong correlation between the measure of institutions and income per capita.
The estimate indicates that there should be on average a 94 log point difference between the log GDPs of the corresponding countries (or approximately a difference equivalent to 154 percent of the GDP of the poorer country). In practice, this GDP gap is 185 log points (approximately 540 percent).
(d) Which variable is endogenous here and why? Does the bias expected by the authors have a clear sign?
Ri , which is the protection against expropriation measure, is an endogenous variable because it correlates with random error term. The authors expect a positive bias (better institutions in richer places), however, the fact that the institutions variable is measured with considerable error may bias the OLS estimates downwards.
(e) What is the chosen instrument and why it is valid? (Remember, you should explain why it is correlated with the endogenous variable and why it is not correlated with the error term.)
We treat the protection against expropriation variable, Ri, as endogenous, and model it as
Ri = ζ +β log Mi + Xi + vi ,
where Mi is our settler mortality rate. Mortality rate explains protection against expropriation variable but doesn’t correlate with random error term and have no direct influence on income per capita.
(f) Summarize the main contribution of the paper in one paragraph.
The authors used econometrics to explain how current economic performance of countries depends on mortality rate. They used the statistics of 17-19 centuries to show a pattern that countries which used to have worse institutions are poorer now that those where private property and reduced government interference were cultivated. The mortality rate influences GDP in a such way: ‘settler mortality rates were a major determinant of settlements; that settlements were a major determinant of early institutions;…that there is a strong correlation between early institutions and institutions today; and finally that current institutions have a first-order effect on current performance’. The main contribution of the paper that its authors could show a dependence using not only common factors like climate or location but a new variable (protection against expropriation) and find a suitable instrument to clarify this variable.
InstallShield Express программасы
Инсталяциялық программалардың ішіндегі ең танымалдысы InstallShield Express. Borland компаниясы осы программаны қолдануға кеңес береді, сондықтан бұл программа Borland Delphi 7 Studio орнату дискісінде бар.
Мысалға бізге Аэропорт программасының инталяциялық дискісін құру керек. Жұмысты бастау үшін бізге керекті файлдардың тізімін, лицензиондық тексті, және ReadMe файлын дайындаймыз. Керекті файлдар 1-ші кестеде көрсетілген.
1-ші кесте. Аэропортпрограммасының файлдары
| Файл | Сипаттама | Қайда орнату керек | ||
| Airport.exe Airport.chm Readme.rtf list.rtf | Программа Анықтаманың файлы Программа туралы қысқаша анықтама Лицензиондық келісім | Program Files\Airport Program Files\Airport Program Files\Airport Program Files\Airport |
Дата добавления: 2014-11-30; просмотров: 3830;